Finance Dashboard
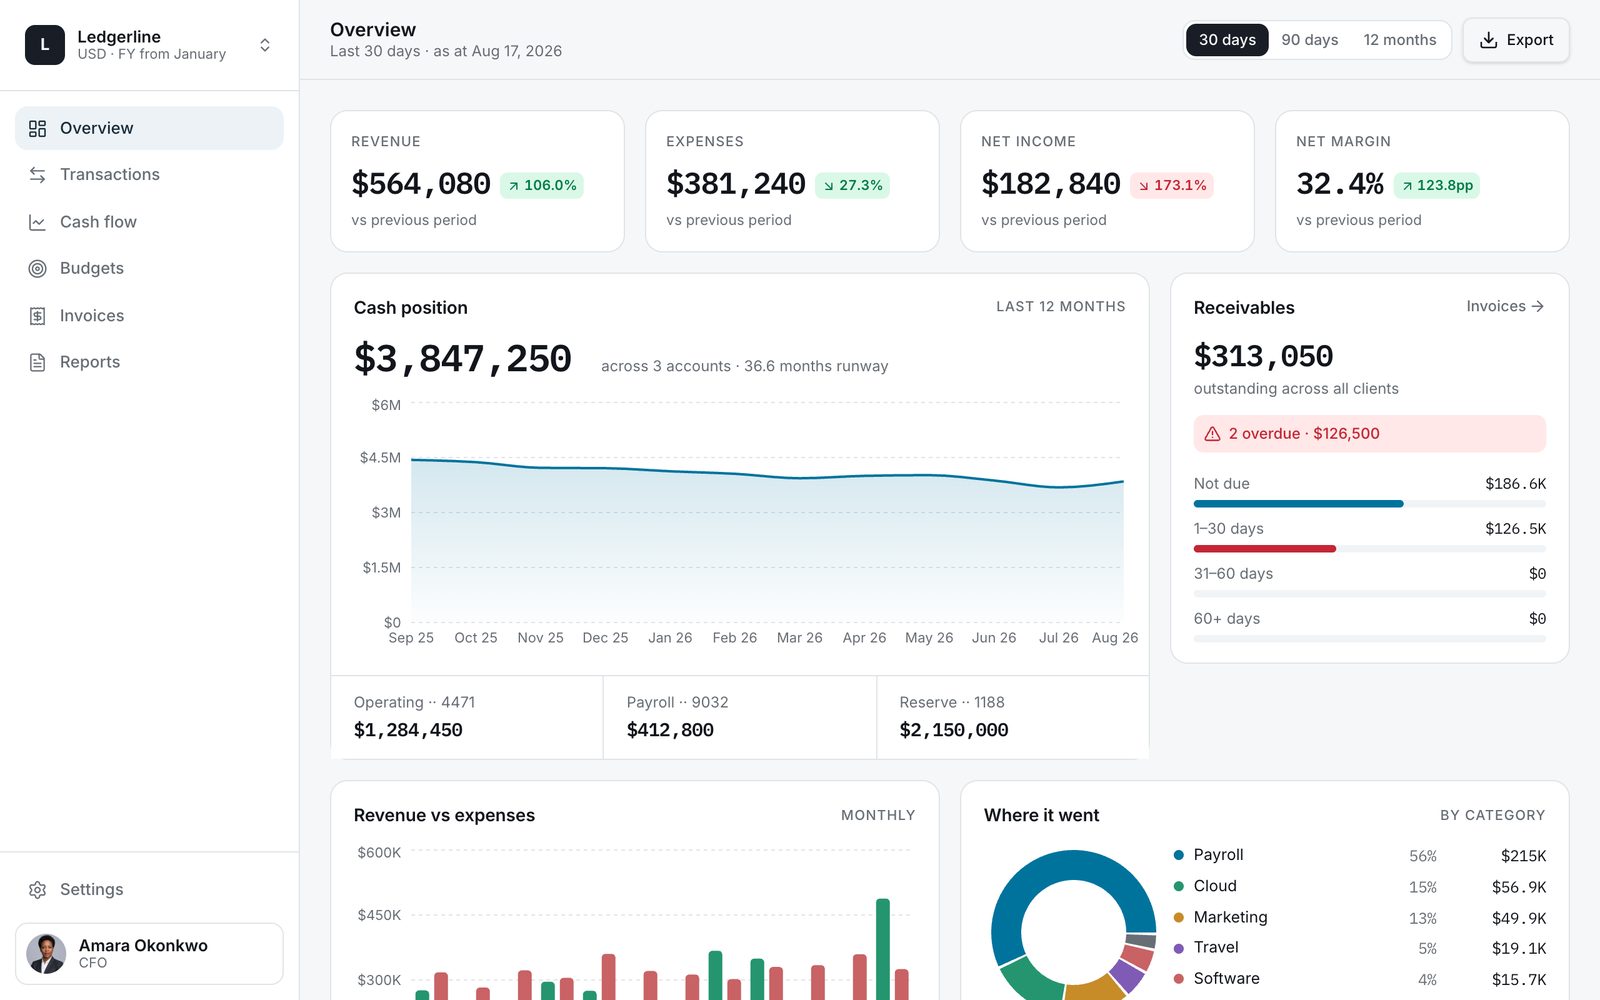
Finance workspace — cash position, P&L against prior period, budget variance, receivables aging and a filterable ledger
Vibely
Creates your own copy. Free to start.
Designed for
- Founders who want the numbers without opening the accounting software
- Finance and ops teams building an internal reporting view
- Anyone reporting to a board or an investor monthly
- Developers who need charts and money arithmetic already correct
Key highlights
About this template
A finance workspace where every figure on every page derives from one ledger. Cash position, profit and loss, budget variance and receivables aging are views of the same transactions, not six separately invented numbers.
The dataset is generated from a seeded random number generator against a pinned date. That sounds like an implementation detail and is actually the difference between a dashboard that works and one that does not: Math.random() or new Date() at module scope produce different data on the server than in the browser, and React throws the whole page away on the mismatch.
The money handling is deliberate too. A negative renders with its sign even where one was not explicitly asked for, and anything that ranks or averages months excludes the month in progress — a 17-day month otherwise wins best month by not having reached payroll.
Best use cases
Founder's numbers dashboard
Cash, runway and this month against last, without a login to the accounting system.
Monthly board reporting
P&L against the prior period and budget variance, in a form you can walk someone through.
Receivables chasing
Aging buckets that make it obvious which invoices have gone quiet and how long ago.
Any metrics dashboard
The pattern — one seeded dataset, many derived views — transfers to analytics well beyond finance.
Getting started
Step 1: Remix this template
Click Use template. Vibely copies the full source into a new project, boots a sandbox and brings the preview up — you are looking at a running app, not a static mockup, before you have typed anything.
Step 2: Describe your first change
Tell the chat what you want in plain language. It reads the project the same way you would, edits the files and shows you the result in the preview. You can also open the code and edit it directly at any point.
Step 3: Understand the data model
src/lib/finance.ts generates the ledger and src/lib/metrics.ts derives every figure from it. Read those two before changing a page.
Step 4: Connect your real ledger
Replace the generator with your own source — a Supabase table, a CSV import, or an accounting API. The derived views keep working because they only read the ledger.
Step 5: Set your categories and budgets
Categories, budgets and the reporting periods are data. Match them to your chart of accounts and the variance page is yours.
Step 6: Keep the money rules
If you rewrite the formatting, keep the signed-negative rule and the exclusion of the in-progress month. Both exist because their absence looks completely fine and is completely wrong.
Publish when it looks right
Publish gives the project a live URL. Connect a custom domain in project settings, or export the whole codebase to GitHub and deploy it yourself — nothing here is locked in.
Conclusion
Finance dashboards fail in a specific way: they look right and are wrong. This one is built the other way round — one source of truth, derived views, and the arithmetic edge cases handled where they normally are not.
Features & capabilities
Cash position
Where the money is now, and how it got there over the period you select.
P&L against prior period
This period beside the last, with the movement on every line rather than only the total.
Budget variance
Planned against actual per category, with over- and under-spend called out.
Receivables aging
Outstanding invoices bucketed by how overdue they are, so the follow-up order is obvious.
Filterable ledger
Every transaction, narrowed by category, account, period or text.
Recharts reporting
Charts with animation switched off, so they render fully on first paint and in screenshots.
One seeded dataset
A deterministic generator against a pinned date — the same figures on the server and in the browser, every time.
Money arithmetic that holds
Negatives always carry their sign, and averages exclude the month in progress.